Gallery
The viewer on a synthetic asset — every image
below is rendered from ps.synth_asset data through model.save_view(...). No
confidential data appears anywhere.
Map — areal structure
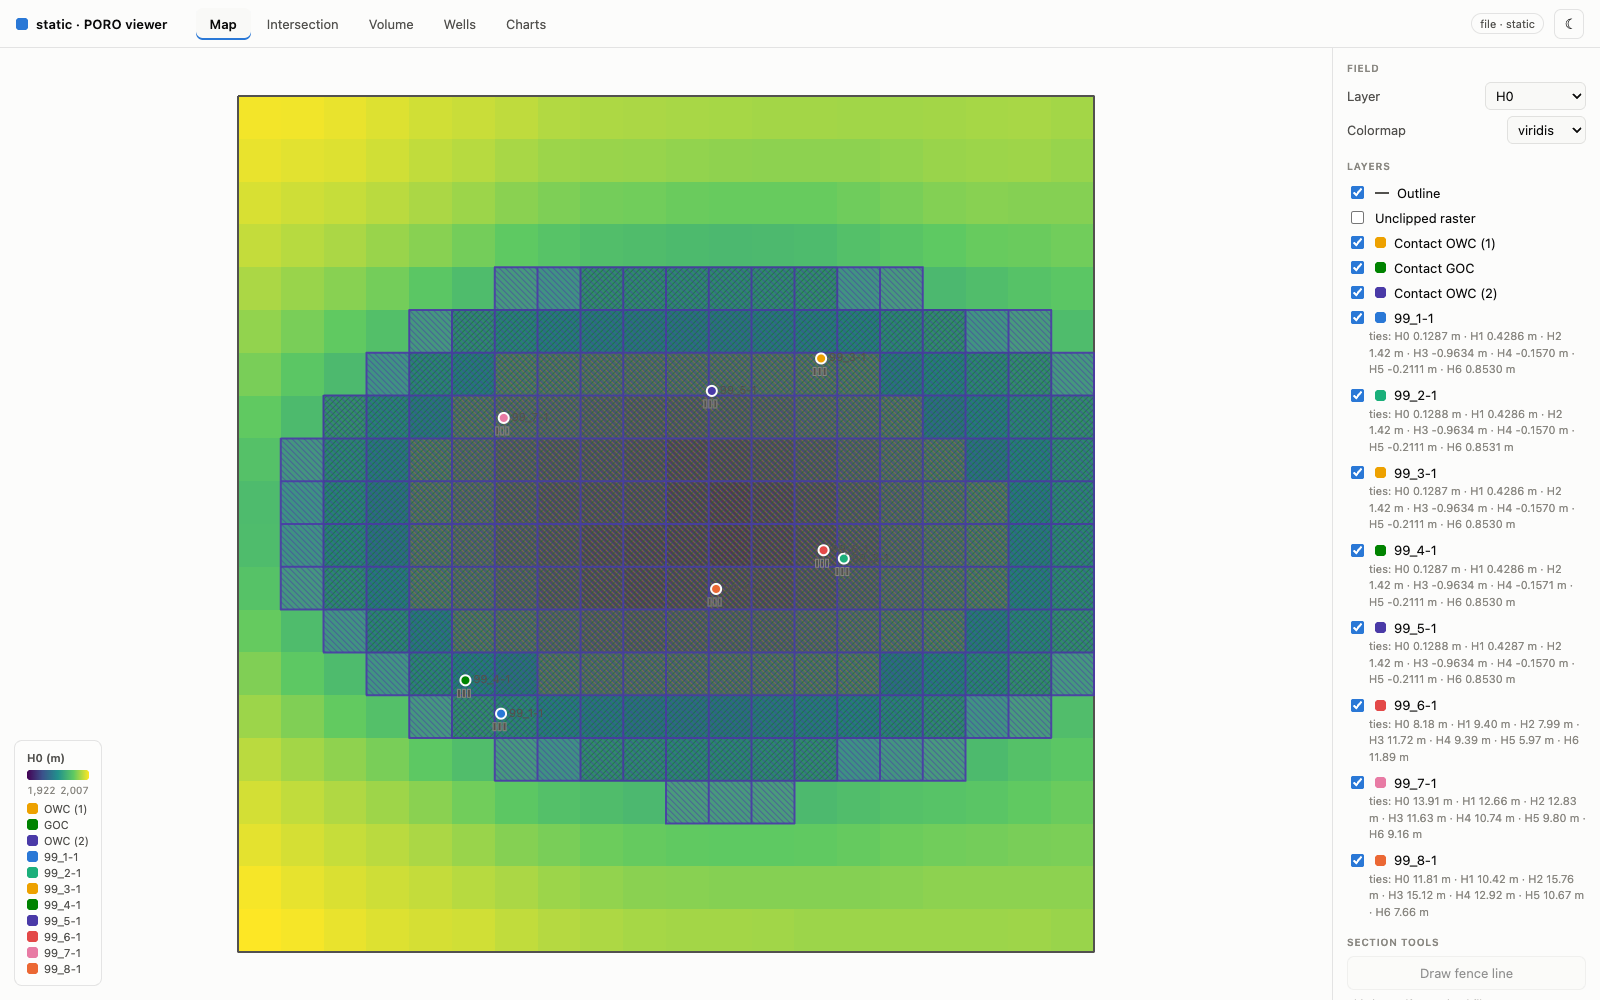
The Map tab defaults to the top-horizon depth raster, clipped to the outline, with per-kind contact subcrop masks and well markers.
Intersection — coloured by property
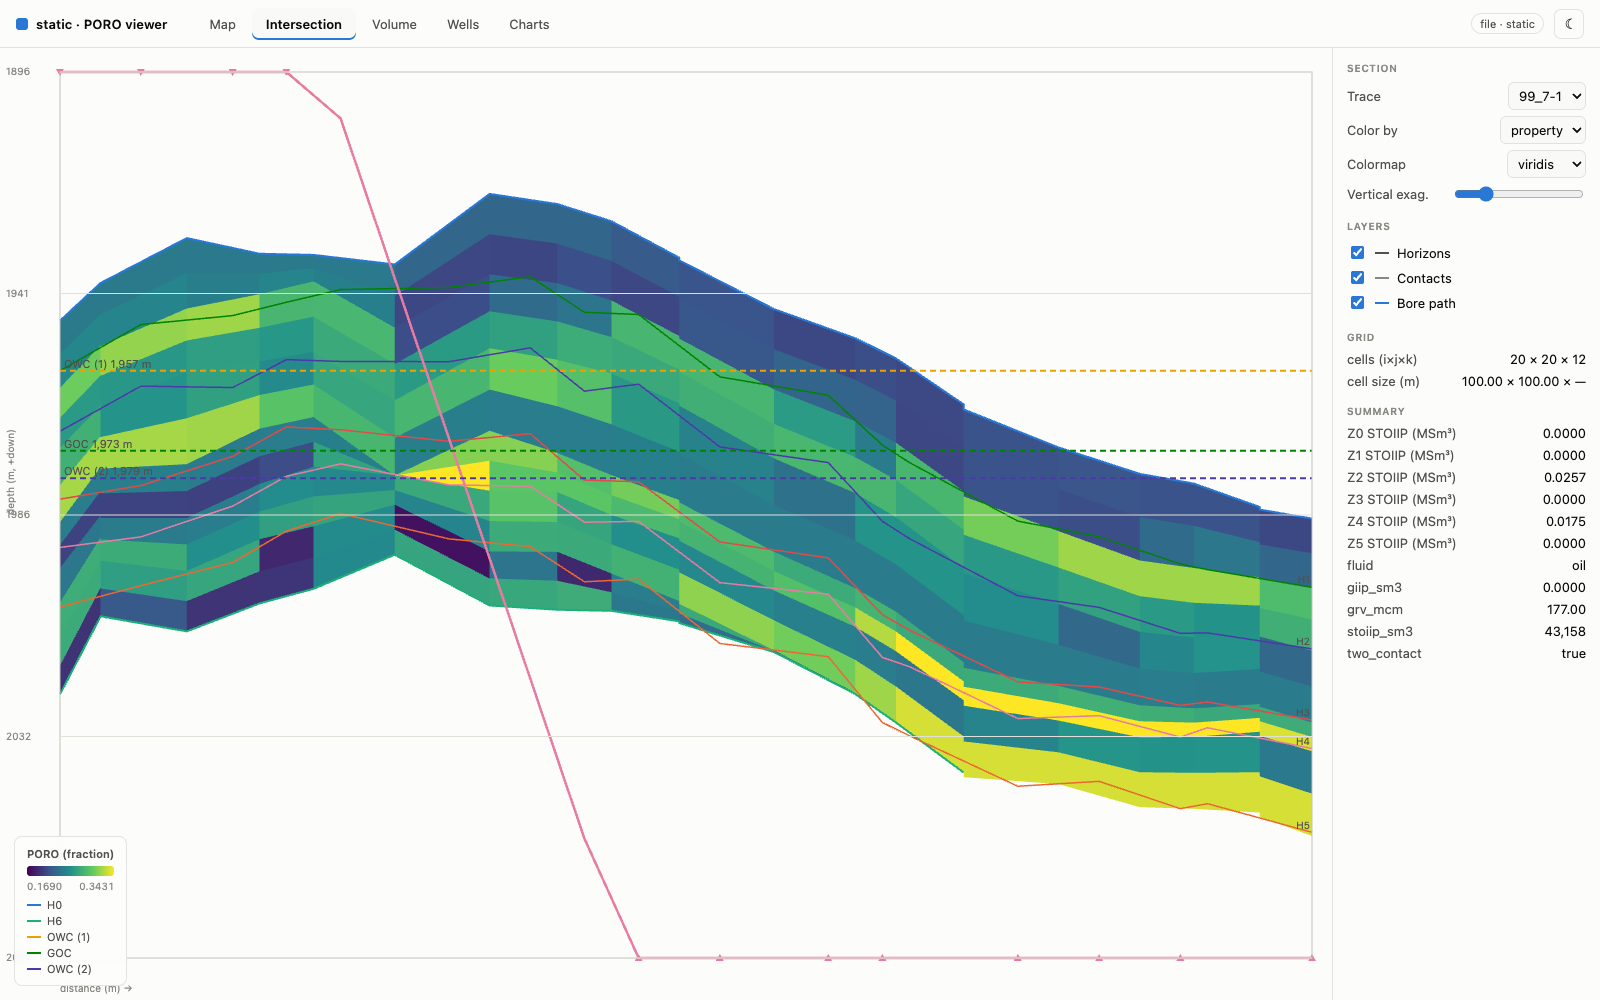
A vertical cross-section, each cell a dipping trapezoid following the zone edges, filled by the property colormap with horizon and contact traces overlaid.
Intersection — coloured by zone
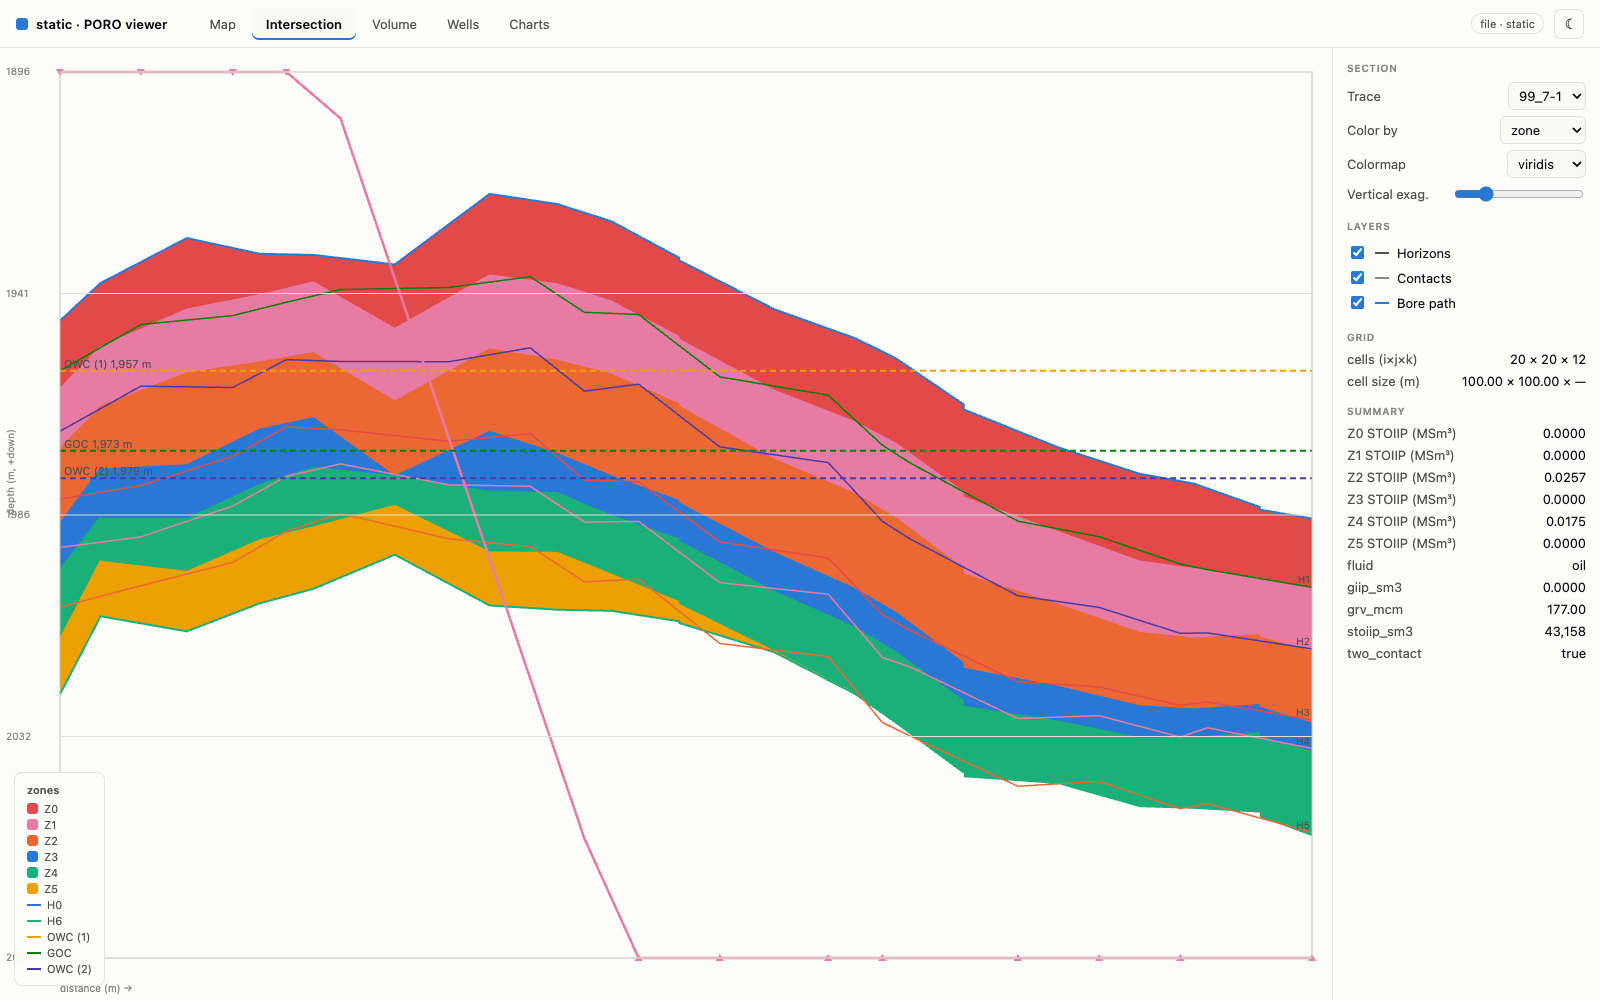
The Color by: zone select swaps the fill to the fixed categorical zone identity — the same colour a zone wears in the Volume and Wells tabs.
Volume — the corner-point shell
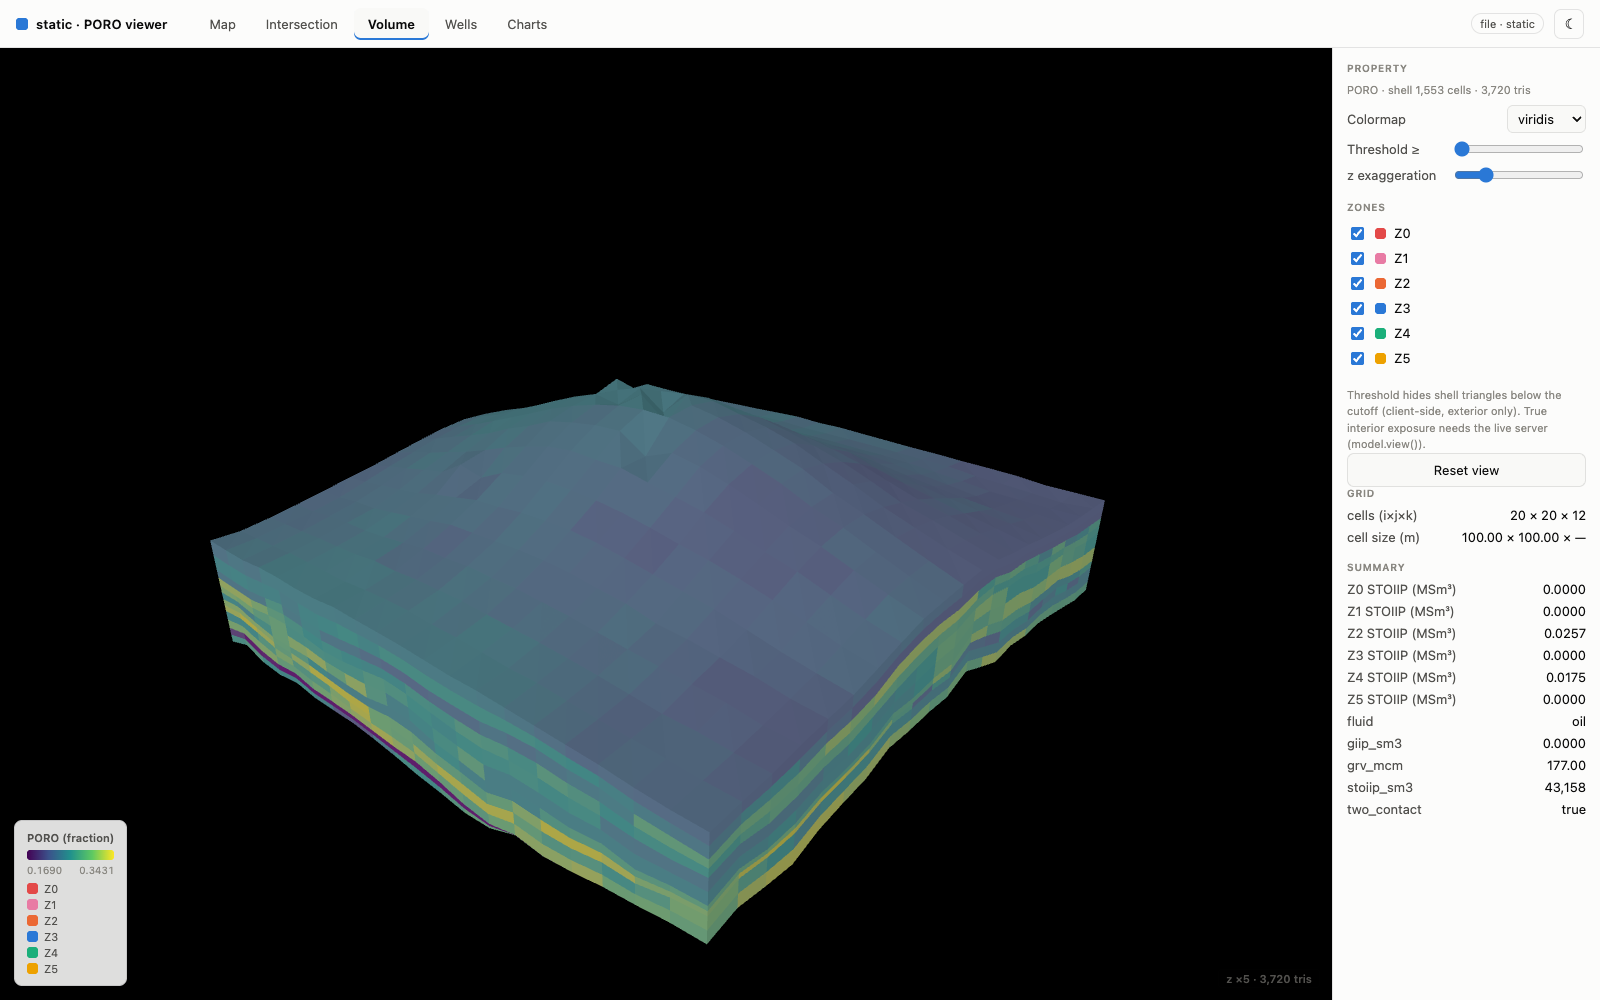
The corner-point cell exterior shell, flat-shaded per cell, with threshold and z-exaggeration sliders and per-zone toggles.
Wells — TVD correlation
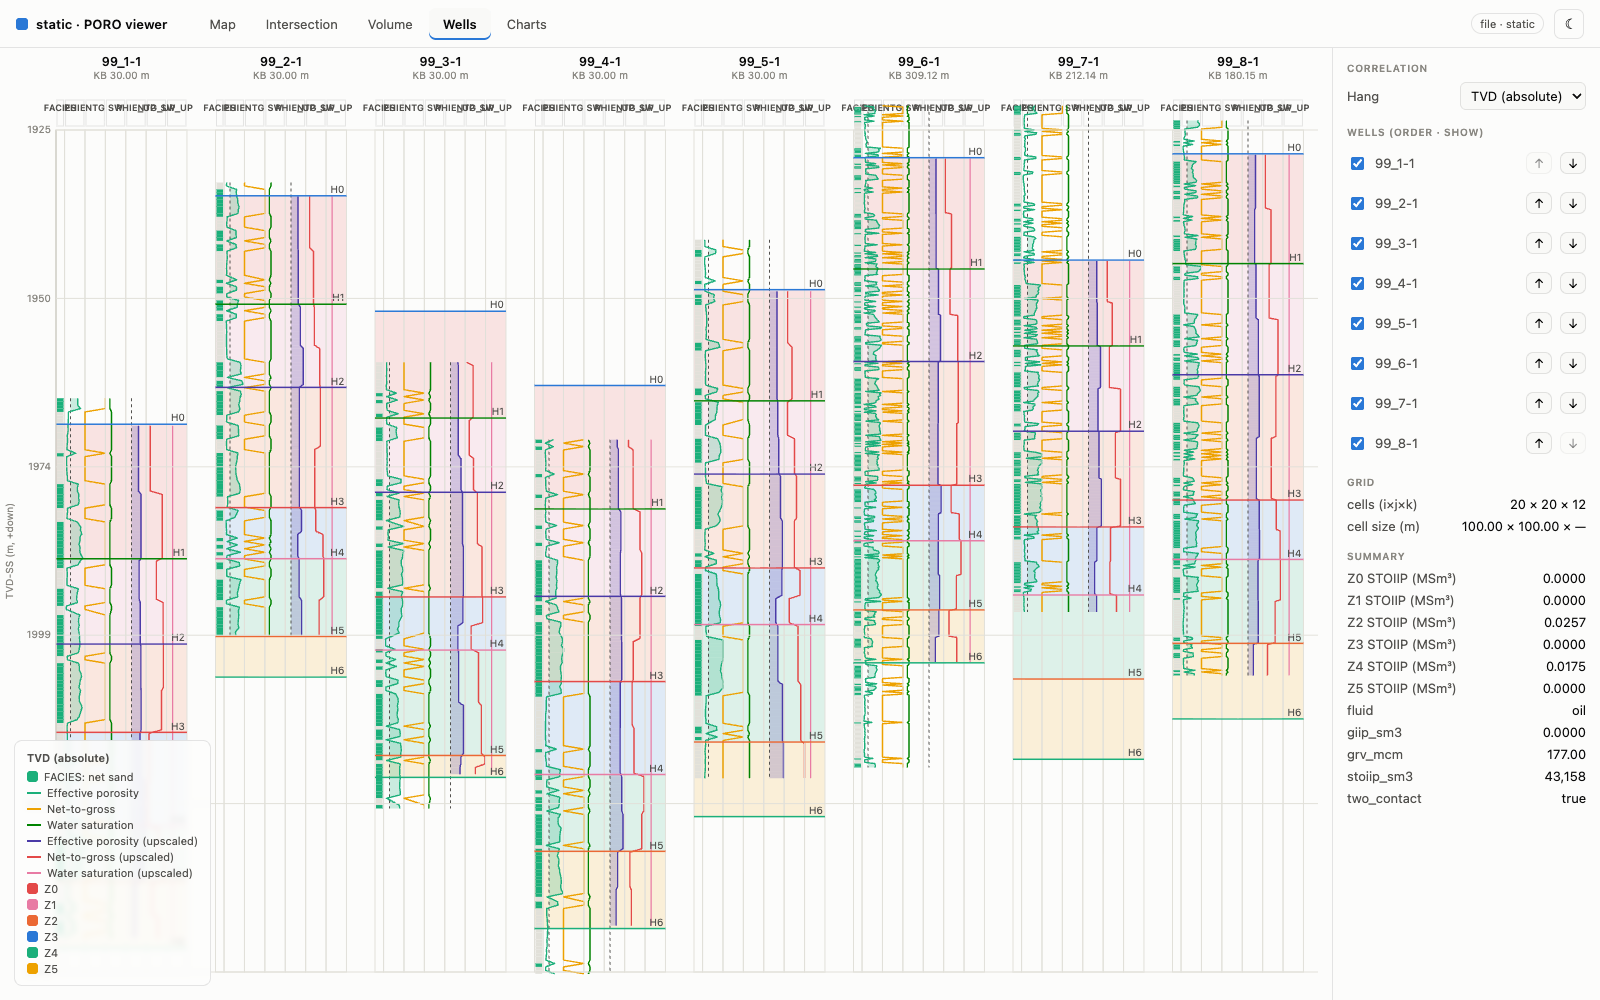
Multi-well log correlation on a shared absolute-TVD axis — raw and upscaled curves per bore, tops as cross-track lines, zones shaded in identity colour.
Wells — flattened on a pick
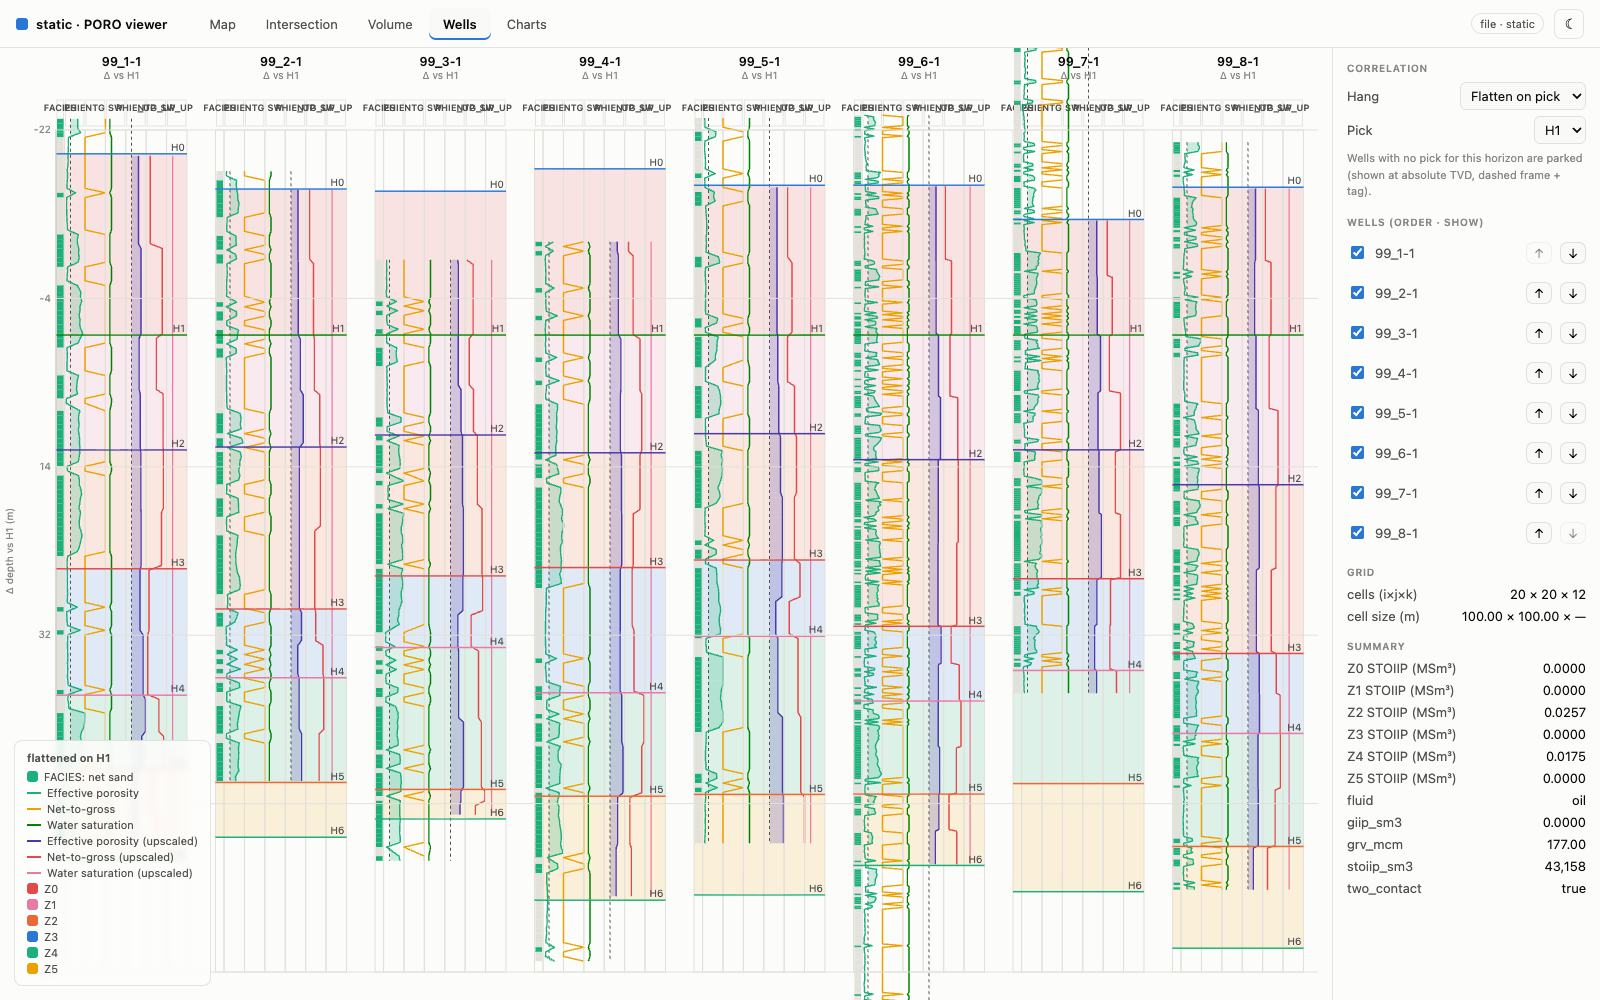
The flatten-on-pick mode shifts every well so a chosen horizon aligns at Δ = 0 — the correlation transform, viewer-side.
Charts — analytics
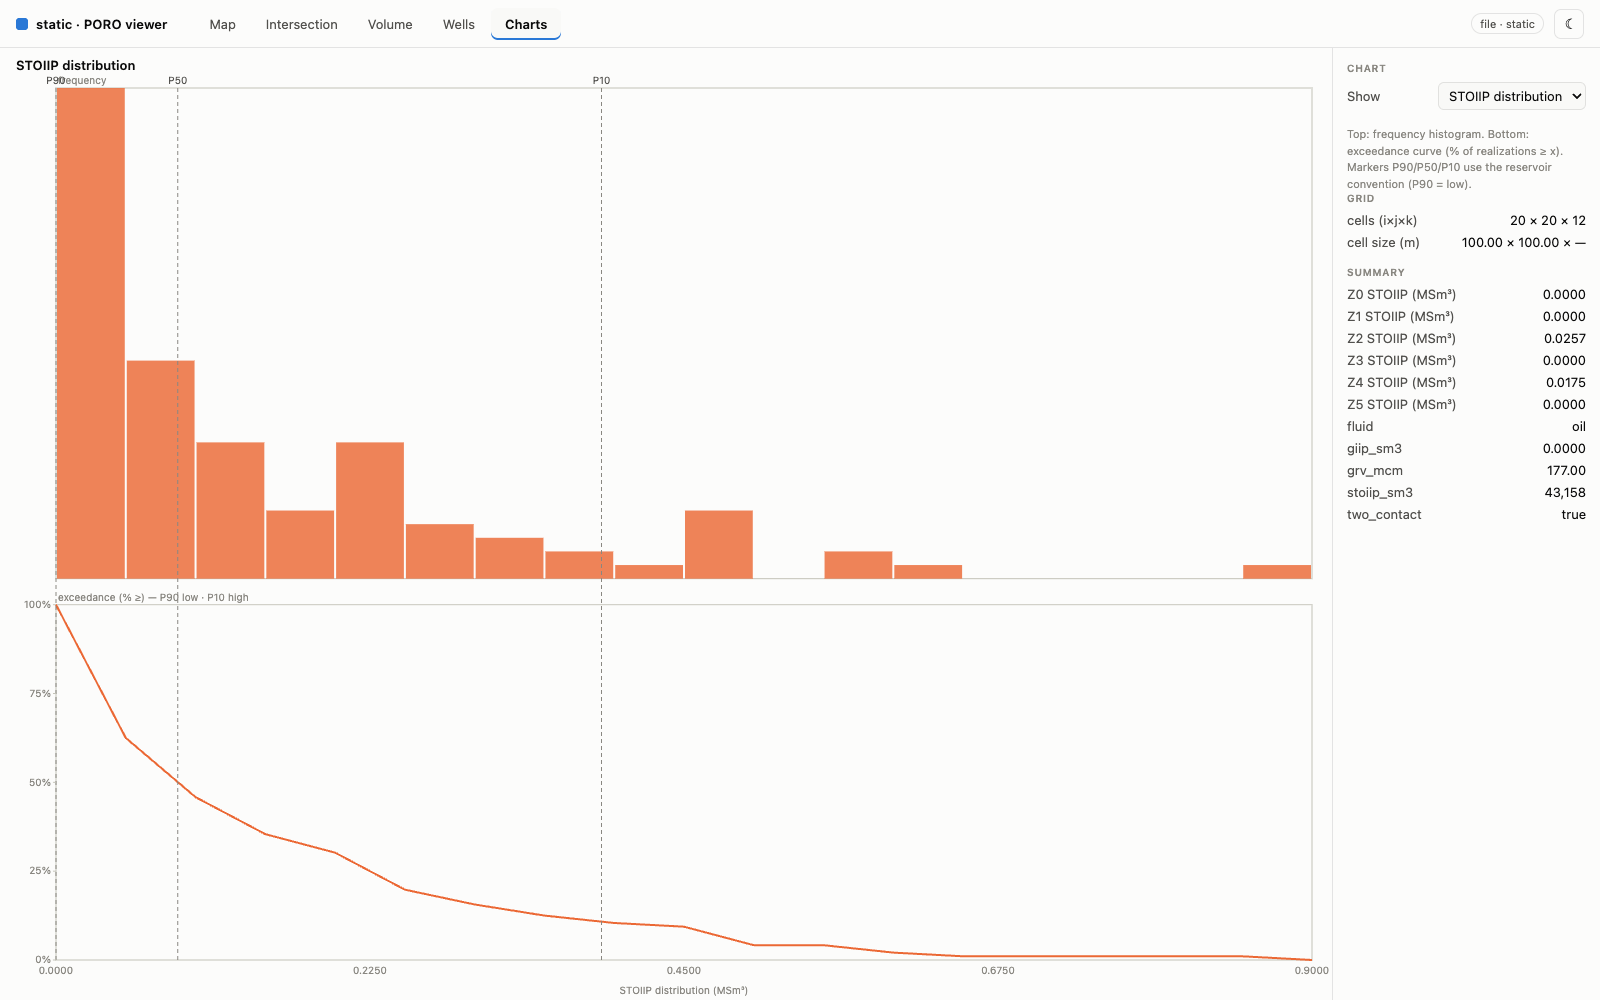
The Charts tab renders pre-computed analytics — tornado sensitivity, the STOIIP distribution (histogram + exceedance CDF with P90/P50/P10 markers), crossplots.
Dark mode — map
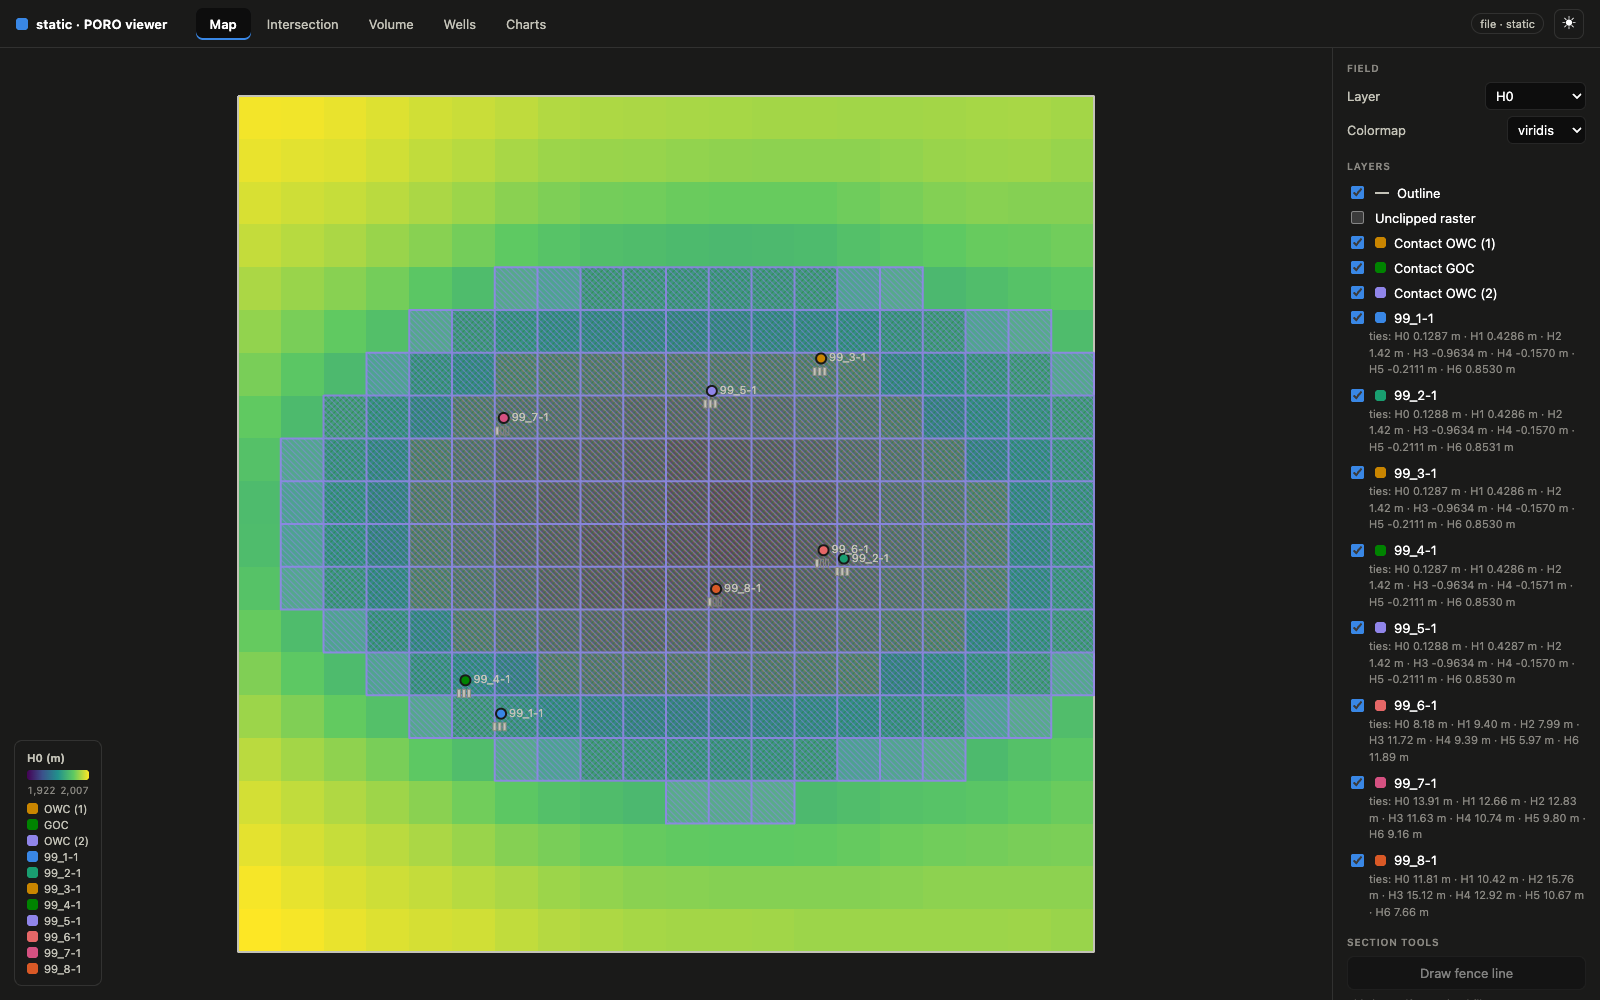
Dark mode is selected, not auto-flipped — a separately-chosen, CVD- and contrast-validated palette.
Dark mode — volume
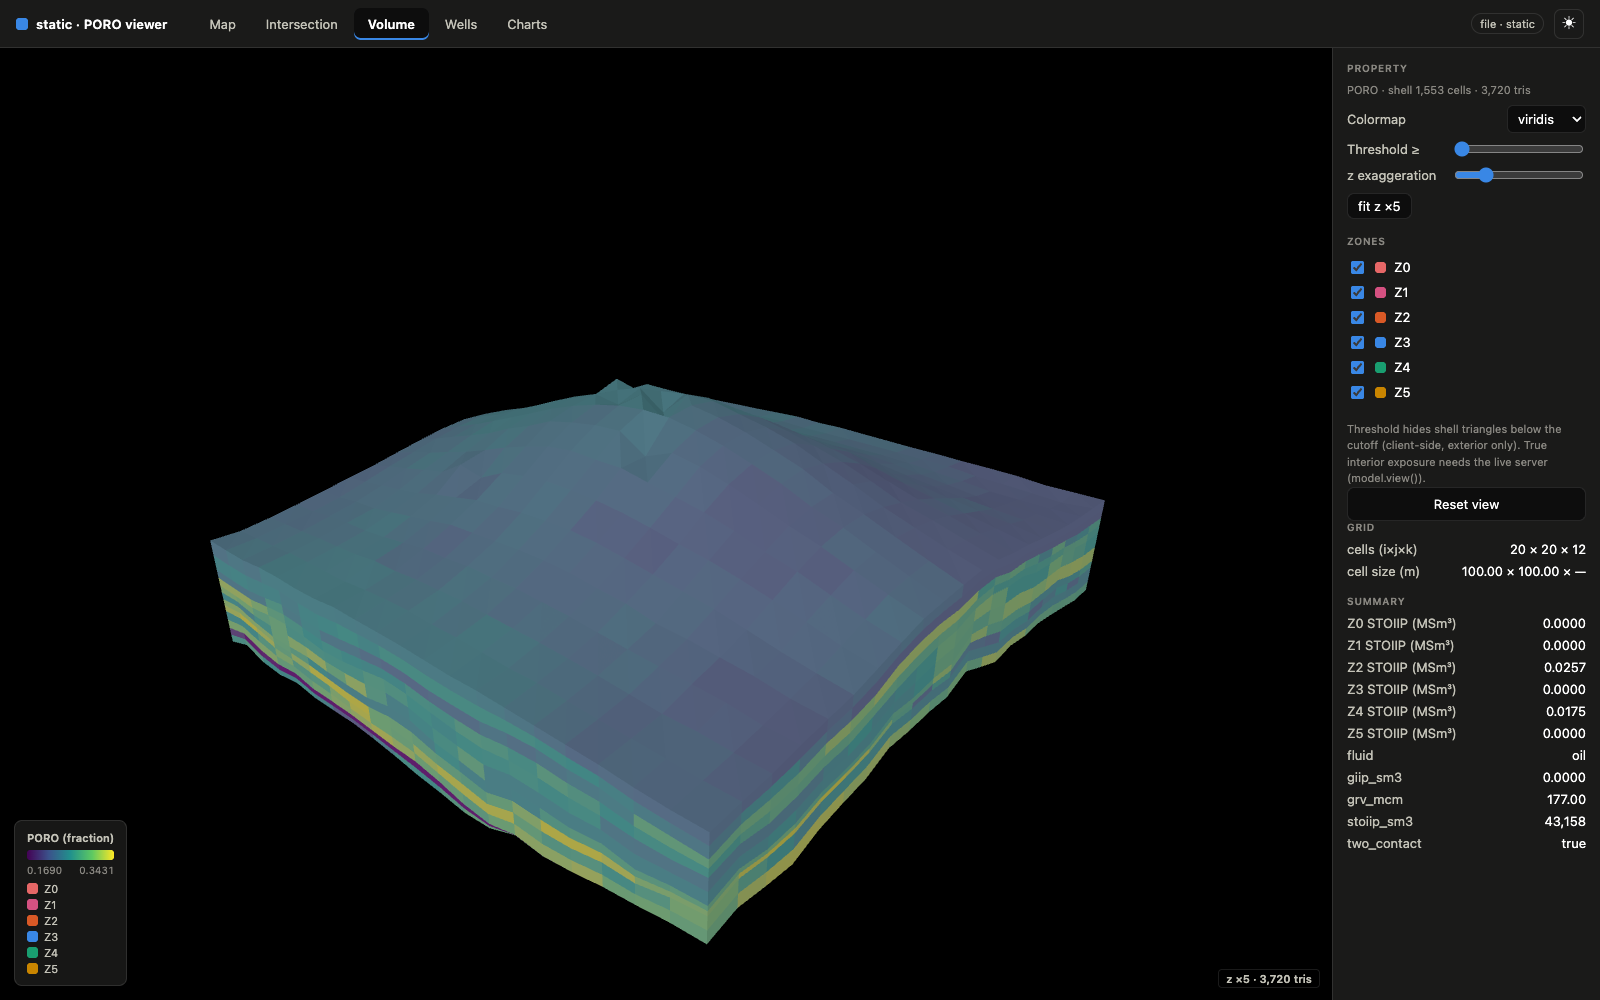
The volume shell in dark mode; categorical identity colours are preserved across the theme flip.
Volume — graceful auto-degrade
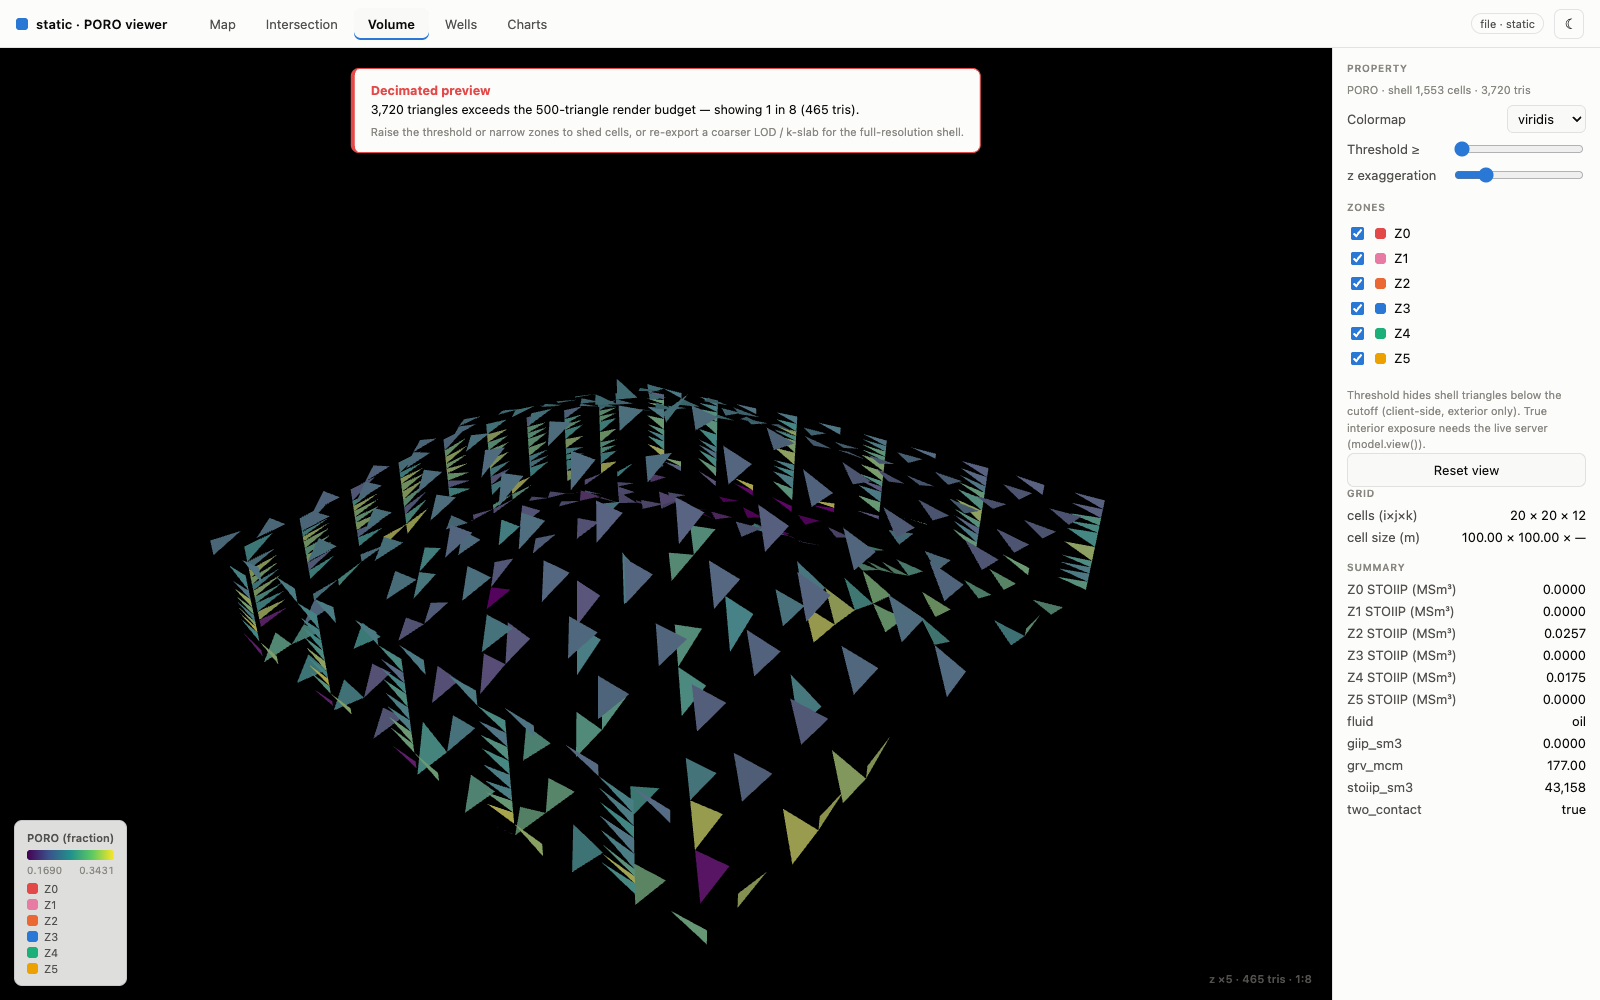
Past the triangle budget the viewer auto-degrades to a decimated preview and says so in a loud banner — it never crashes, OOMs, or blanks silently.